I have Jetpack activated on some websites but not on others. Recently, I was asked by another blogger whether the Jetpack plugin slows down WordPress websites.
So, I decided to test it. This article shows you my test results. We also explain how you can test the performance of Jetpack on your own website and decide for yourself.
Table of Contents
Summary Of Speed Tests On Jetpack
When you install the Jetpack plugin on WordPress, it increases the page load time and the number of requests with each additional feature that you enable.
Our tests on a fast-loading page added 300-400 milliseconds to the page load speed. This decrease in speed is too small to be noticeable.
In general, Jetpack does not slow down a WordPress website.
However, the increased number of page requests when adding the related posts feature and the shares feature could be detrimental to a busy website.
If you don’t think these Jetpack features are needed on your website, you should disable them.
How To Test If Jetpack Slows Down A Web Page
The basic premise of testing is to compare the page speed of a web page when Jetpack is not installed and then after it is activated.
We like to use the free GTMetrix tool to test page speed. There are other alternatives.
Step 1: Create a test page or use an existing page
Our test page was created using the Gutenberg editor. It has eight hundred words broken up into multiple subheadings, standard paragraphs, and bullet points.
The page also has eight images to give a bit of “weight” to it.
We also posted and approved a couple of comments under the article.
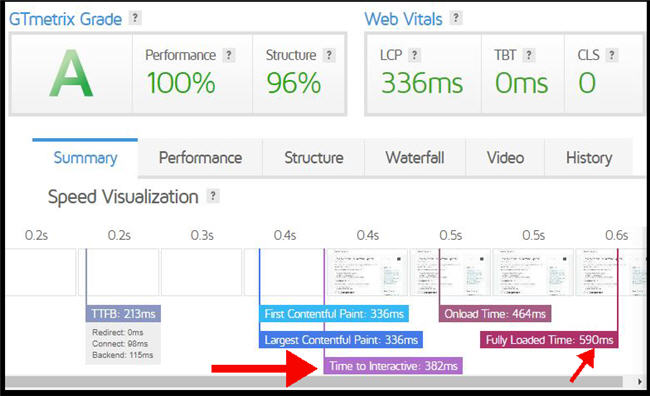
This is the GTMetrix baseline speed score:
Step 2: Install and activate Jetpack
At this point, I installed and activated the free Jetpack plugin.
There are several plugins provided by the same developers with similar names. I’m testing the one named “Jetpack – WP Security, Backup, Speed, & Growth”:

These are the most popular features in the free Jetpack:
- Downtime monitoring
- Site accelerator
- Related posts
- Social shares
Some people will only use the site accelerator and never bother with related posts or social shares. But others will enable the full shebang (not necessarily recommended!).
To cater for different configurations, I tested these combos in succession:
- monitoring + accelerator
- monitoring + accelerator + posts
- monitoring + accelerator + posts + shares
You enable and disable these options through the Jetpack settings dashboard.
Quick detour
Unfortunately, I hit a snag on this website that I hadn’t hit before with the Jetpack plugin. When I enabled Site Accelerator, some of the images on the test page had disappeared. So, I had to go investigate that issue.
You can read about the solution in our article on how to stop Jetpack from breaking images.
Our Jetpack Performance Tests
GTMetrix gives you plenty of results to mull over. But we like to focus on these three:
- Time To Interactive
- Fully Loaded Time (this one isn’t as important as Time To Interactive)
- Number of requests
Here are our results averaged over several test runs:
| Test Page | Time To Interactive (ms) | Fully Loaded Time (ms) | Number Of Requests |
| Without Jetpack | 382 | 590 | 16 |
| Monitoring + Accelerator | 523 | 761 | 21 |
| Monitoring + Accelerator + Posts | 588 | 800 | 23 |
| Monitoring + Accelerator + Post + Shares | 663 | 955 | 25 |
Now, let’s explain what we’re actually measuring!
Increase In “Time To Interactive” And “Fully Loaded Time”
Here’s a quick explanation of the time measurements.
“Time To Interactive” basically means how long it takes for the web visitor to be able to scroll around the page.
It’s more of a “quality” metric. If it’s above two seconds, we should be worried that the user will perceive that the website is slow.
“Fully Loaded Time” is when all the resources have been loaded by the page. That includes every image, all scripts, and any external calls to other sites.
In our testing, the page without and with Jetpack were both interactive and fully loaded in under one second. Although it was a tight squeeze for the fully loaded time.
Each additional Jetpack feature saw a small increase in the load times.
Jetpack Increases The Number Of Requests
Each Jetpack feature increased the number of requests made by the page.
I’ll show how you can tell by looking in more depth at the first test of adding the Site Accelerator.
The waterfall tab of GTMetrix shows you what’s going on. Part of the Site Accelerator feature switches the call to some CSS scripts from your site to the WordPress servers.
You can see the “wp.com” domain highlighted in the screen capture below.
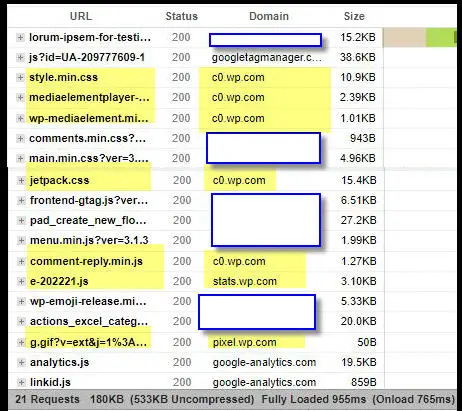
There’s a trade-off to be made here. The page is making extra requests to an external site, but the idea is that the powerful WordPress servers will serve those scripts faster than your host can.
So, that’s all good for the Site Accelerator feature.
But what about the extra requests for the “Related Posts” and “Shares” features? I advise that you consider carefully whether your website needs these features.
You can save a few extra page requests by turning them off!
What About Other WordPress Plugins?
Do you use other plugins on your WordPress site? We’ve tested some of the more common ones.