If you’re used to traditional code editors like Visual Studio or even VBA macros in Excel, you may find that notebooks take a little getting used to. I did!
A Databricks notebook is a web-based interface to an interactive computing environment. Notebooks are used to create and run code, visualize results, narrate data stories, and collaborate with others.
The goal is to allow data engineers and data scientists to work together in an interactive manner.
Table of Contents
How Notebooks Are Different To Code Editors
Here are some key differences for developers to be aware of.
A key feature of Databricks is that you can write code in different languages within the same notebook. You don’t do that with traditional code editors.
Another departure is the ability to intersperse code and formatted text in markdown. This allows the analysts to add commentary and graphs to the code.
You also get typical word processing features like auto-saving and revision history.
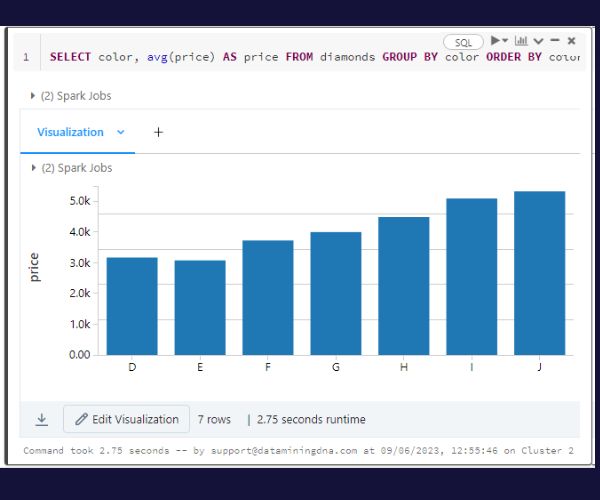
Built-in visualization is another key feature. When you run code that produces plots or charts, these are displayed directly beneath the code section.
This picture shows a SQL query and the output beneath it in a bar chart format. Another user could choose to change the visualization to a pie chart.
Developers can also create dashboards from notebooks. This provides a handy way to share insights and findings with non-technical stakeholders.
How To Use A Databricks Notebook
Databricks notebooks are made up of several components that allow you to write code, execute commands, visualize data, and document your work. Here’s a breakdown of the key parts:
Cells
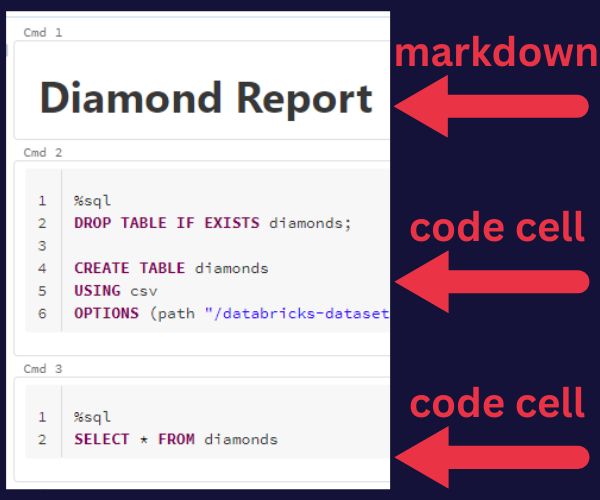
A notebook is divided into segments called “cells”. These are the basic units where you can input code or text. There are two main types of cells: code cells and markdown cells.
Code cells are where you write and execute your code. When you run or execute the cell, the results are displayed directly below the cell.
They can be run individually, in groups, or all at once.
Markdown cells allow you to input text using markdown. This is a lightweight markup language, in other words it’s like HTML (but different).
You use markdown cells to add narrative such as headings and subheadings. You can also create lists, ad links to web pages, and even images or videos.
Output Area
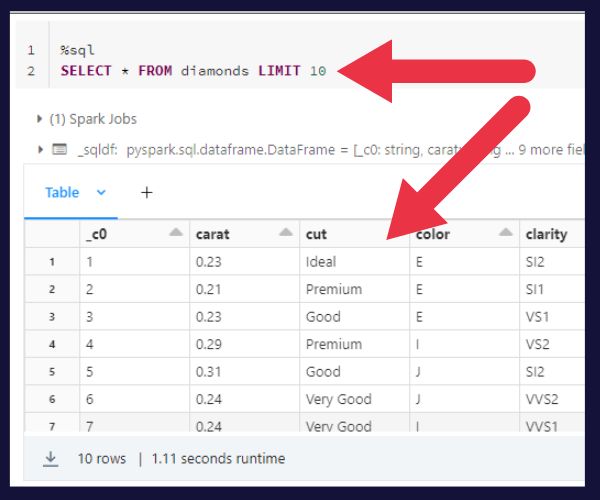
The output area appears below each code cell, displaying the results of the code execution.
This can include printed text, tables, data frames, plots, or even interactive visualizations, depending on the code you’ve written.
The picture below shows the output of a SQL statement that returns ten rows from a table.
The output area is also where you’ll see error messages. When you’re trying to fix issues with your code, check out our article on debugging Databricks notebooks.
Basic Editing
If you like to jump straight into things without reading the manual, I’ll give you some pointers to the not-so-obvious editing features.
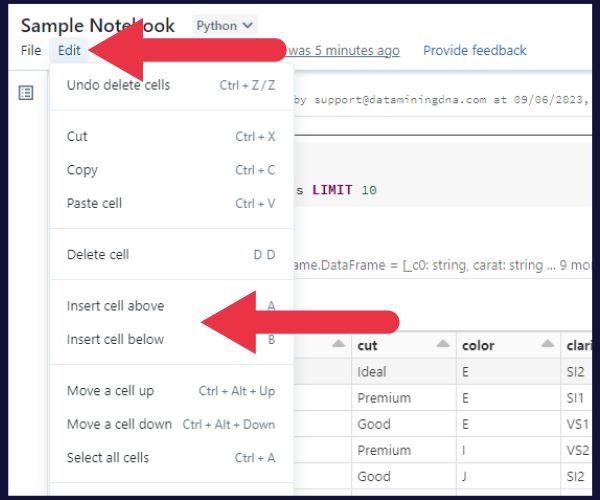
You can use the edit drop-down menu to add cells. If you intend to be a regular notebook user, I advise that you learn and practice the short-cuts for these simple actions.
To edit an existing cell, double-click inside it.
Use the dropdown menu at the top right of each cell to tell the Notebook whether you are writing markdown, SQL, Python, or another language. If you try to run SQL in a Python cell, you’ll get a syntax error.
How Notebooks Fit Within the Databricks Platform
In the Databricks environment, notebooks connect to a computational cluster that can be scaled up or down according to the requirements of the task at hand.
The platform integrates with various data sources (e.g. S3 or Snowflake) and supports multiple data formats.
Notebooks natively support several languages, including Python, Scala, SQL, and R. You can even switch between languages in a single notebook.
Notebooks are also integrated with many popular data science libraries and frameworks, such as TensorFlow, PyTorch, Scikit-learn.
These features allow users to perform exploratory data analysis, build machine learning models, and create rich visualizations directly within their notebooks.
Multiple users can sign into the Databricks platform and work on a notebook simultaneously. They see each other’s inputs in real time, as they would with something like Google Docs.
In terms of automation, Databricks notebooks can be scheduled to run as jobs. This is a handy feature for reports that need to be generated on a regular schedule.
They can also be exported in various formats, such as HTML, PDF, or even Jupyter Notebooks.
Collaborating With Databricks Notebooks
Notebooks allow real time collaboration within the same notebook. It’s like working with a souped-up version of Google Docs.
If you’re wondering how that doesn’t create chaos, here are my top three tips for effective collaboration.
1. Make Use Of Commenting
Databricks notebooks support commenting within cells.
You can leave comments on a particular cell, and other users can respond to these comments. This helps reducing confusion.
2. Revision History Reduces Conflict
Databricks notebooks automatically save changes and keep a history of revisions. You can revert to a previous version of the notebook if necessary.
This is particularly useful when collaborating with others, as it allows you to track changes made by different contributors and rollback changes if needed. It can stop a few office arguments!

3. Apply Permissions
You can set permissions at the notebook level. These control who can view, edit, or manage the notebook. This can be configured for individual users or user groups.
So, if you have a manager that you don’t want to “help” with your notebook (i.e. break it), restrict them to viewing privileges.
Four Types Of Visualizations With Notebooks
One of the strengths of Databricks notebooks lies in their powerful visualization capabilities. This is what makes them popular with data scientists.
Here are four types of visualizations you can achieve:
- Tables and basic charts
- Complex charts from external plotting libraries
- Interactive visualizations
- Dashboards
Tables and In-Built Charts
When a command in a Databricks notebook returns a data table, the notebook automatically provides a user-friendly interface for visualizing this data.
A tab appears beneath the code cell displaying the table, with options to choose between various plot types like bar charts, line charts, scatter plots, area charts, etc.
You don’t get that with most code editors.
Integration with Plotting Libraries
Databricks notebooks support a wide range of external visualization libraries. That includes Matplotlib, Seaborn, ggplot2, Bokeh, and Plotly.
This provides flexibility for more complex or customized visualizations.
Interactive Visualizations
Databricks notebooks are compatible with libraries that generate interactive plots.
For example, Plotly and Bokeh allow the creation of plots with zoom, pan, hover-to-highlight, and click-to-select functionalities.
Dashboards
A dashboard is a collection of visualizations, tables, and other views within a single notebook.
These dashboards can be shared with other users and stakeholders, allowing a suite of analytics to be delivered in a single package.
Automating And Scheduling Features

As part of the Databricks platform, you also get access to automation and scheduling features. Remember that your notebook runs on a computing environment. If you want more details of what’s under the hood, check out our article on databricks clusters.
Aside from clusters, the platform terminology includes:
- Jobs
- Workflows
- Alerts
- Automation APIs
Jobs
In Databricks, you can create a “job” from a notebook that you’ve packaged with parameters to execute.
You can schedule jobs to run on a schedule or on a trigger (e.g., in response to an API call). This can be useful for daily reports, or for triggering a script after an ETL process finishes.
Workflows
Databricks notebooks support calling other notebooks as part of a workflow. This lets you break down complex analyses into manageable, reusable parts.
You can have one ‘master’ notebook that orchestrates other notebooks, each performing a specific part of the overall analysis.
Alerts
You can configure Databricks to send you an alert if a scheduled job fails, completes, or takes longer than expected to run. The alert can be an email, a text message, or even a call.
This can help you ensure that your automated tasks are running smoothly.
APIs
Databricks provides a REST API that you can use to create, manage, and run jobs programmatically.
This can be useful if you want to trigger Databricks jobs from external systems. They also come into play when you’re managing a lot of jobs and want to automate the process.
Version Control Is Limited
Version control allows teams to track and manage changes to their code. Databricks notebooks provide several features to support version control. However, this is quite limited when compared to traditional programming.
Basic versioning is provided by a notebook’s revision history. You can view the revision history, revert to a previous version, or make a new copy of the notebook at a specific point in the history.
Most developers will be familiar with using git or a similar system for version control that allows sophisticated control through commits, pushing and pulling changes, and creating and merging branches.
Databricks introduced their Repos system to offer similar features. However, Repos don’t (yet) offer advanced git functionality like resolving conflicts.
If you’re an analyst or a manager, don’t be surprised if you get some push-back from developers about this aspect of Databricks. Bad source control can drive them crazy (here’s an amusing but educational take on the topic).

Origins Of Notebooks
Databricks certainly didn’t invent the concept of a notebook. If you don’t want a quick history lesson, skip this section.
The first appearance arose from Mathematica, an environment and programming language used in STEM fields for complex maths analysis.
Its developers rolled out “computational documents” in 2007 as a code editor with added commentary and reports. This was an early implementation of what we call “notebooks” now.
But Mathematica was and is rather niche in terms of programming environments. The general introduction to a wider base of programmers was with the development of Jupyter.
iPython -> Jupyter
Jupyter’s early name was iPython. It was an open-source project started in 2001 to create a better interactive experience for Python developers. It rolled out a notebook interface in 2005 that drew a lot from Mathematica but was still quite primitive.
2011 was a key year. The notebook interface expanded to allow code, text, mathematical expressions, and visualizations in the same document.
The iPython team spun out a separate project called Jupyter in 2014 to provide a language-agnostic environment. That was the start of the classic Jupyter Notebook that offers a bundle of tools in one web-based document:
- Code editor
- Rich text editor
- Terminal
- File browser
- Rich outputs
Notebooks in Databricks are based on the Jupyter Notebook.
Why Use Databricks Instead Of Jupyter Or Google Colab?
I’ve already talked a bit about Jupyter which is still popular. You should also be aware of Google Colab which is the mighty Google’s version of a notebook platform.
In this section, I’ll discuss some pros and cons if you’re choosing between the three platforms.
To get started with Jupyter notebooks, you usually need to install the Python notebook package on your local machine or server. This isn’t difficult for Python developers. But it may be a little daunting for data scientists without a programming background.
The advantage of both Databricks and Google Colab is that the environment is provided and serviced for you. You just need an account on the platform.
So, let’s talk about accounts. For Colab, all you need is a free Google account (e.g. a Gmail account) to run code and visualizations.
Google largely provide their platform as a free service. Jupyter is also free. In contrast, Databricks provides the community edition for free, but it’s very limited in usage.
But there’s no such thing as a free mega-lunch…I mean mega-loads. Databricks was designed from the start to handle large data volumes. That’s what you’re paying for. You’ll struggle to run big data projects with Jupyter or Colab.
The Databricks platform also offers powerful job scheduling and automated features that are built in to the system. With Jupyter, you’ll need to use external tools for this. Colab also doesn’t have these capabilities.