Debugging is an essential part of the coding process. Even the most experienced programmers make mistakes. It’s through debugging that these mistakes are found and fixed.
Each cell in a Databricks notebook has its own output, and any error messages are also displayed in the cell output. This is usually the starting point for your investigation.
But Databricks provides a number of additional ways to help you debug your notebooks. This article shows you how to use:
- traditional print and logging methods
- the interactive Python debugger
- the new Databricks Variable Explorer
- the Spark Cluster UI and the Cluster Event Logs
Before we dive into these methods, let’s start with common errors you’ll be dealing with.
Table of Contents
Common Errors And Exceptions In Databricks Code

The errors and exceptions you encounter when running code in Databricks fall into five categories:
- Syntax errors
- Dependency errors
- Runtime errors
- Spark errors
- Cluster errors
Syntax Errors
These are probably the most straightforward to debug.
Review your code with an eye out for typographical errors. You may also fall foul of indentation issues, which tends to come with inexperience.
Dependency Errors
You’ll get dependency errors when the code in a cell depends on a package or library that hasn’t been installed on the cluster.
If you’re sure that you installed the appropriate packages, check whether the cells are running in a different order than what you expected (a few print statements can help).
Runtime Errors
These are what to watch out for:
- Type errors e.g. concatenating a string with an integer
- Index errors e.g. accessing an element in a list that doesn’t exist
Spark Errors
Spark exceptions are most likely to occur when you’re executing a Spark job that hits an error. Watch out for jobs that:
- Run out of memory
- Have serialization errors
Cluster Errors
Your notebook depends on the cluster it is attached to, so problems underneath the hood can bubble up with cryptic messages.
Watch out for the cluster running out of resources or having connectivity issues. Check out our article on databricks clusters if you need a quick intro to what they do.
Basic Debugging With Print Statements
If you’re used to the sophisticated debugging features of modern coding IDEs like Visual Studio, then you may feel a little underpowered with notebooks.
But you can go a long way with the old-fashioned (and effective) technique of using print statements to debug your code.
In Python, you can use the print() function to display the value of variables or expressions. Similarly, in Scala, you can use println(). You will usually use print statements to track:
- Variable values
- Execution flow
- DataFrame content
Bugs are often due to variables not having the values you expect. By printing out the value of variables at different points in your program, you can narrow down the section of code where something goes awry.
Print statements can be used to trace the execution flow of the program. By adding print statements in conditional blocks or loops, you can check the order of operations and how many times certain loops are being executed.
Here’s an example of checking that a DataFrame in a variable named “df” has the expected volume of data (a zero means you probably have to investigate):
print("The count of rows in the dataframe is", df.count())Error Logging
While print statements are great for debugging during development, they are not recommended for production code. They lack the flexibility and configurability of proper logging.
As you get ready to promote your code into production, you should switch to using a logging library. This allows you to set different logging levels, output logs to different destinations, and more.
To do so, you’ll need to import the logging module and set up basic configuration. This only needs to be done once, typically at the beginning of your notebook. Your code will look like this:
import logging

logging.basicConfig(level=logging.INFO)
The basicConfig function sets up the default handler so that debug messages are written to the console. This can be changed to writing to a physical log. Our tutorial on writing from Databricks to S3 will give you some pointers.
The level argument sets the root logger level to the specified severity level. Setting it to INFO as in our example will produce a lot of logging. You can filter it to WARNING or ERROR to be more selective.
You can replace the print statement from the previous section with a logging statement as follows:
logging.info("The count of rows in the dataframe is %s", df.count())How To Use The Interactive Python Debugger In A Notebook
Python cells give you access to what’s known as the pdb – the Python debugger. It’s clunkier than debuggers you may be used to in desktop IDEs, but it gets the job done.
When your code throws an error, the notebook will stop and highlight the error. At this point, you can enter debug mode by running this command in the next cell:
%debugThe output will show the current state of the variables set within the problem cell. You will also get the ipdb (interactive python debugger) interface embedded within the cell.
This picture shows the code stopped by a division by zero exception. I have entered the %debug command in the cell below.
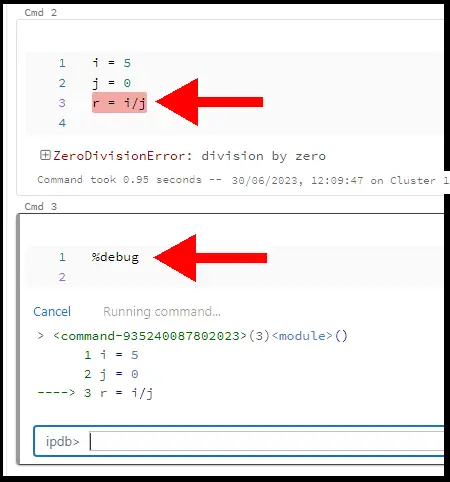
At the bottom of the picture, the interactive Python debugger box (ipdb) has opened. Here, you can type in the name of other variables to display their state.
When you’re finished with the ipdb, you can type:
- C (or continue) to run the next cell
- Exit
- Cancel
How To Set A Breakpoint With The Debugger
You can use the Python debugger to set breakpoints in specific cells.
To do so, you should import the library at the top of your notebook or before you set the first breakpoint:
Import pdbThen you can add breakpoints to specific areas with this line:
pdb.set_trace()In the picture below, the last line will have a division by zero error. But before that line is executed, I have added a breakpoint with the set_trace method.
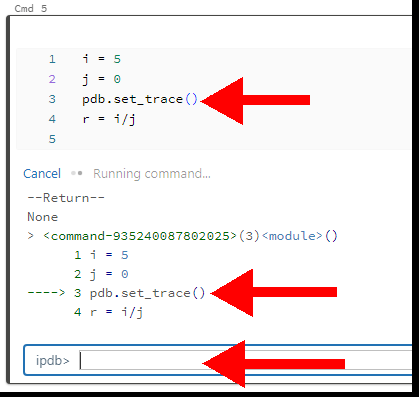
The notebook stops executing at the trace line and opens the interactive Python debugger command line. You can execute the next line by entering C or continue.
The Databricks Variable Explorer
Databricks rolled out the new Variable Explorer in May 2023 to assist in debugging.
Instead of typing in variable names in the Python debugger, you now have a visual tool to view all the variables. It displays on the right hand side of the screen.
It’s particularly useful for looking at DataFrames. The Visual Explorer doesn’t just give you a preview of the data, it lets you quickly explore the schema. This is very handy when dealing with a wide set of columns.
Other Databricks Tools For Debugging
You should get familiar with these tools within the Databricks environment. They will be invaluable in your debugging efforts.
Spark Cluster UI
The easiest way to access the Spark UI when you’re working in your notebook, follow these steps:
- Expand the cluster dropdown in the top right of the page.
- Click on the attached cluster.
- Click on “Spark UI” in the menu.
This opens the Spark UI page in a separate tab. Here, you can view the details of your Spark job, including tasks, stages, and storage. You can also see if there are any failed tasks and inspect the error messages and logs for those tasks.
Cluster Event Logs
I showed in the previous section how to access the cluster detail page.
The cluster detail page has several tabs, including the Event Log. If you are experiencing cluster exceptions (e.g. loss of connection), you may get more detail here.
Alternatives To Using Databricks For Debugging
There are plenty of critics who consider the Databricks environment to be unsuitable for debugging a complex code base. They prefer to use the more extensive features and tools provided by IDEs like Visual Studio or PyCharm.
Personally, I think that most tasks required for moving and transforming data around the enterprise can be debugged within a notebook using the techniques described in this article.
However, complex requirements with lots of conditional logic and execution paths are probably not suitable for notebooks. They’ll work fine when running perfectly. It just takes too much labor and time to figure out what’s happening when they go wrong.
I suggest that this complex code is only prototyped in notebooks. Then it should be moved to versioned scripts that can be stepped through within IDEs with more sophisticated debugging features.